

Research on distributed optical fiber monitoring and early detection technology of dry shrinkage and cracking of soil
Oct 07, 2023
Overview
Mastering the development rules of the internal strain field during the development of dry shrinkage cracks in soil is an important prerequisite for studying the formation mechanism of dry shrinkage cracks in soil. However, conventional monitoring methods cannot obtain the deformation characteristics of the internal soil and cannot meet the requirements of soil dry shrinkage. Requirements for cracking studies. Tang Chaosheng’s research group proposed a new method for refined monitoring of soil drying shrinkage and cracking process based on distributed optical fiber sensing technology (DFOS-OFDR), and found that the DFOS-OFDR interrogation instrument (OSI-S) can accurately obtain the soil drying and cracking process. The spatial and temporal evolution characteristics of the strain field during the development of shrinkage cracks can be accurately positioned, and the formation of cracks can be sensed in advance.
Testing process
The recovered clay soil was air-dried, ground and passed through a 2mm sieve. The soil is then mixed with an appropriate amount of water to achieve a target moisture content of about 69% (1.9 times the liquid limit) of the ready-to-use mud. The mud is then vibrated on a vibrating table for 5 minutes to remove all air bubbles, and then poured into a plexiglass mold with a length of 500mm, a width of 50mm, and a height of 50mm one after another. The strain optical cable laying is to first add 800g of slurry (20mm high) into the plexiglass mold and vibrate to obtain a flat surface. The strain optical cable is placed on top of the slurry, and then 400g of the remaining slurry (10mm high) is poured into the mold and carried out. Vibrate to remove air bubbles. It is worth noting that the two ends of the optical cable in the soil sample are not fixed and can settle freely as the soil shrinks. The strain optical cable is fully connected to the DFOS-OFDR demodulator. The schematic diagram of the monitoring device used in the test is shown in Figure 1. The drying test is carried out at room temperature 30±1°C. In order to better capture the initiation and development of soil cracks during the drying process, a digital camera was used to capture high-resolution images every 5 minutes, with the same frequency as the DFOS-OFDR interrogation instrument (OSI-S) sampling.

Figure 1 Schematic diagram of test device
Test Results
Evolution of strain curve with drying time
Figure a shows the spatio temporal evolution of the strain curve from 0 min to 5500 min of drying. As drying proceeds, the strain distribution curve gradually changes from the undeformed state to the overall compressed state, which means that the sample has a tendency to shrink in volume due to water loss, thereby squeezing the internal strain optical cable. There are two obvious compression regions (A1 and A2) in the figure, where the strain peaks range from -250 με to -3000 με (A1) and -500 με to -10000 με (A2). The evaporation of water in the sample starts from the soil surface. As the evaporation process continues, the pores between soil particles begin to form water-air menisci, which leads to the increase of capillary suction and the accumulation of tensile stress. When the accumulated tensile stress increases beyond the tensile strength of the soil, shrinkage cracking will occur in the soil. With the emergence of the first crack (4930 min), tensile strain appears and compressive strain continues to decrease, which means that once the soil cracks, the increase in crack width will increase the tensile stress on the optical cable and produce corresponding tensile strain.
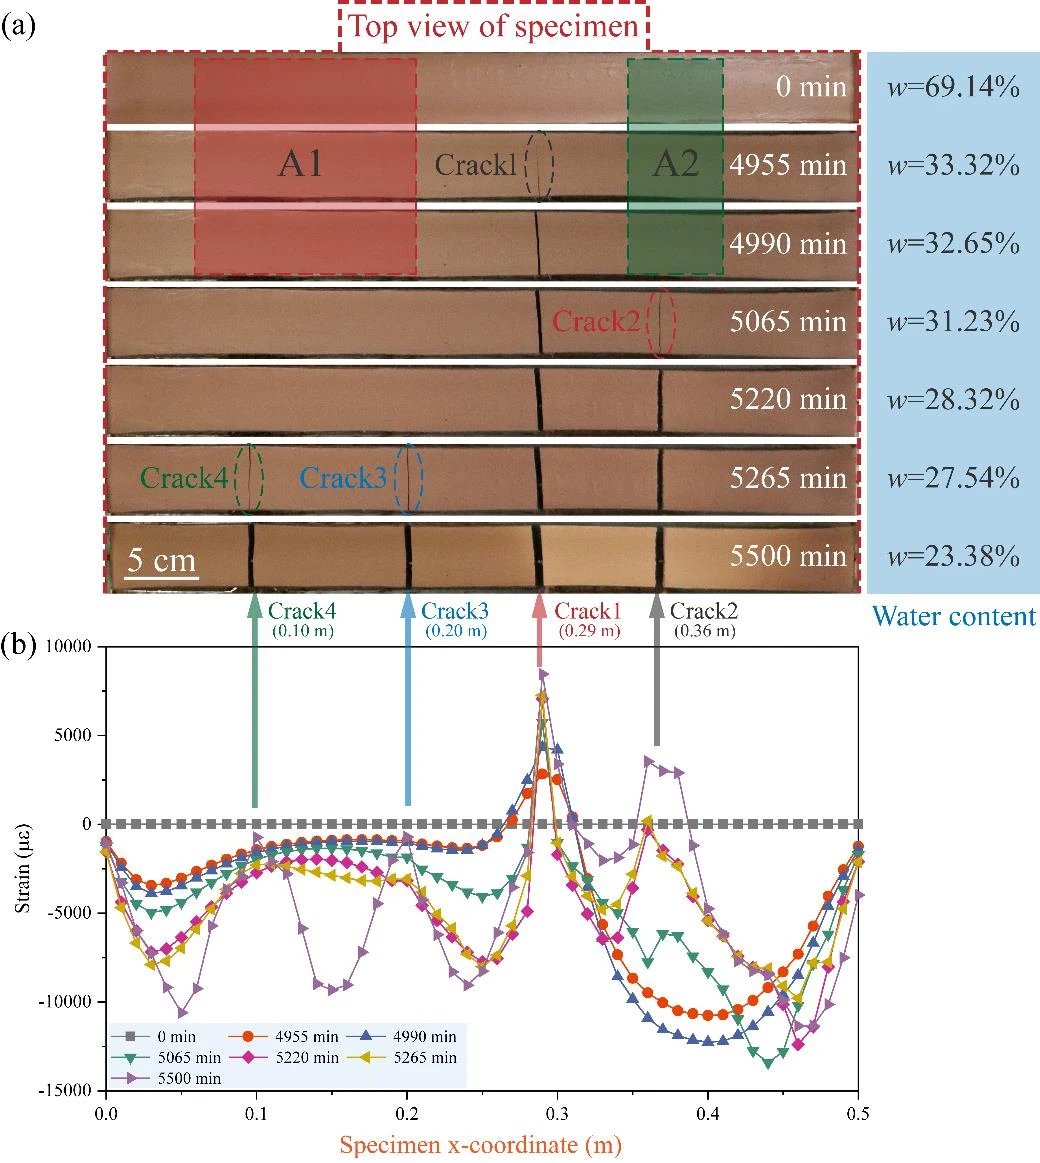
Figure 2 Evolution of soil crack morphology and spatial-temporal evolution of strain curve during the drying process from 0 to 5500 min
As shown in Figure b, there are 4 strain peaks on the strain curve at 0.29m, 0.36m, 0.20m and 0.10m, which are completely consistent with the positions of the 4 cracks. The strain peaks of cracks 1, 2, 3 and 4 at 5500 min are 8457.11 με, 3552.48 με, -719.67 με and -736.39 με respectively. The corresponding crack widths are 6.41 mm, 6.61 mm, 4.45 mm and 4.54 mm respectively. It can be clearly seen that wider cracks usually correspond to larger tensile strains.
Early detection of dry shrinkage cracks in soil
The results obtained in the previous section show that DFOS-OFDR technology can accurately obtain the location of the crack. In order to test whether the proposed technology can perform early detection of the initiation location of soil drying shrinkage cracks, the changes in the width of four cracks and their strain states with drying time were studied. The evolution of the strain state obtained by the optical cable can not only reflect the soil shrinkage before dry shrinkage cracking, but also reflect the entire process of soil crack expansion.
In order to further evaluate whether DFOS-OFDR technology can predict soil drying shrinkage cracking in advance, this study proposed three parameters: Tm (the time when soil cracking is detected by DFOS-OFDR), Tc (obtained through naked eye observation or digital image processing technology) soil cracking time) and ΔTp (time interval predicted in advance, defined as the difference between Tm and Tc).
Figure 3 shows the changes in crack width and strain state with drying time. The first crack (Crack 1) appeared at 4955 minutes, and DFOS-OFDR had already detected the initiation of cracks at 4930 minutes, indicating that DFOS-OFDR technology can detect soil drying shrinkage cracking about 25 minutes in advance. Similarly, for crack 2, crack 3 and crack 4, the corresponding ΔTp values are 55, 40 and 40 min respectively. The accuracy of the DFOS-OFDR demodulator (OSI-S) can reach 1 με. Such high accuracy enables DFOS-OFDR to accurately sense any small deformation inside the soil, allowing early detection of soil cracks. For each crack, the lead time of crack formation predicted by DFOS-OFDR technology is different. This is because although relatively uniform mud was used in the test, the mud cannot be completely uniform, which will affect the distribution of optical cables inside the soil. This affects the lead time of early detection.

Figure 3 Relationship between crack width and crack position strain state
Experimental results
DFOS-OFDR technology can be used to monitor the evolution of dry shrinkage cracks on the soil surface and inside. The strain distribution curve obtained by DFOS-OFDR can accurately capture the soil shrinkage characteristics and crack initiation positions, and obtain the relationship between the crack width and the corresponding strain state with drying time, which can provide help for early detection of the location of cracks. Compared with traditional discrete strain monitoring methods, DFOS-OFDR is a distributed, non-destructive, accurate, efficient and high-resolution soil drying shrinkage cracking monitoring and early detection technology. It is used to study soil surface and internal dry shrinkage cracks. Provide reliable data support.


